The eye-tracking system reveals the user's actual viewed area. Scanpath is a methodology to analyze eye-tracking data. Scanpath represents user's transitions in the focused area from the recorded data.
Our research focused on search results pages in Web search engines. We collected eye movement data for the ranked abstract areas (a document's title, snippet and URL). This tool provides a visualization of the scanpaths on the search results pages.
Input for Scanpath2SVG is as follows:
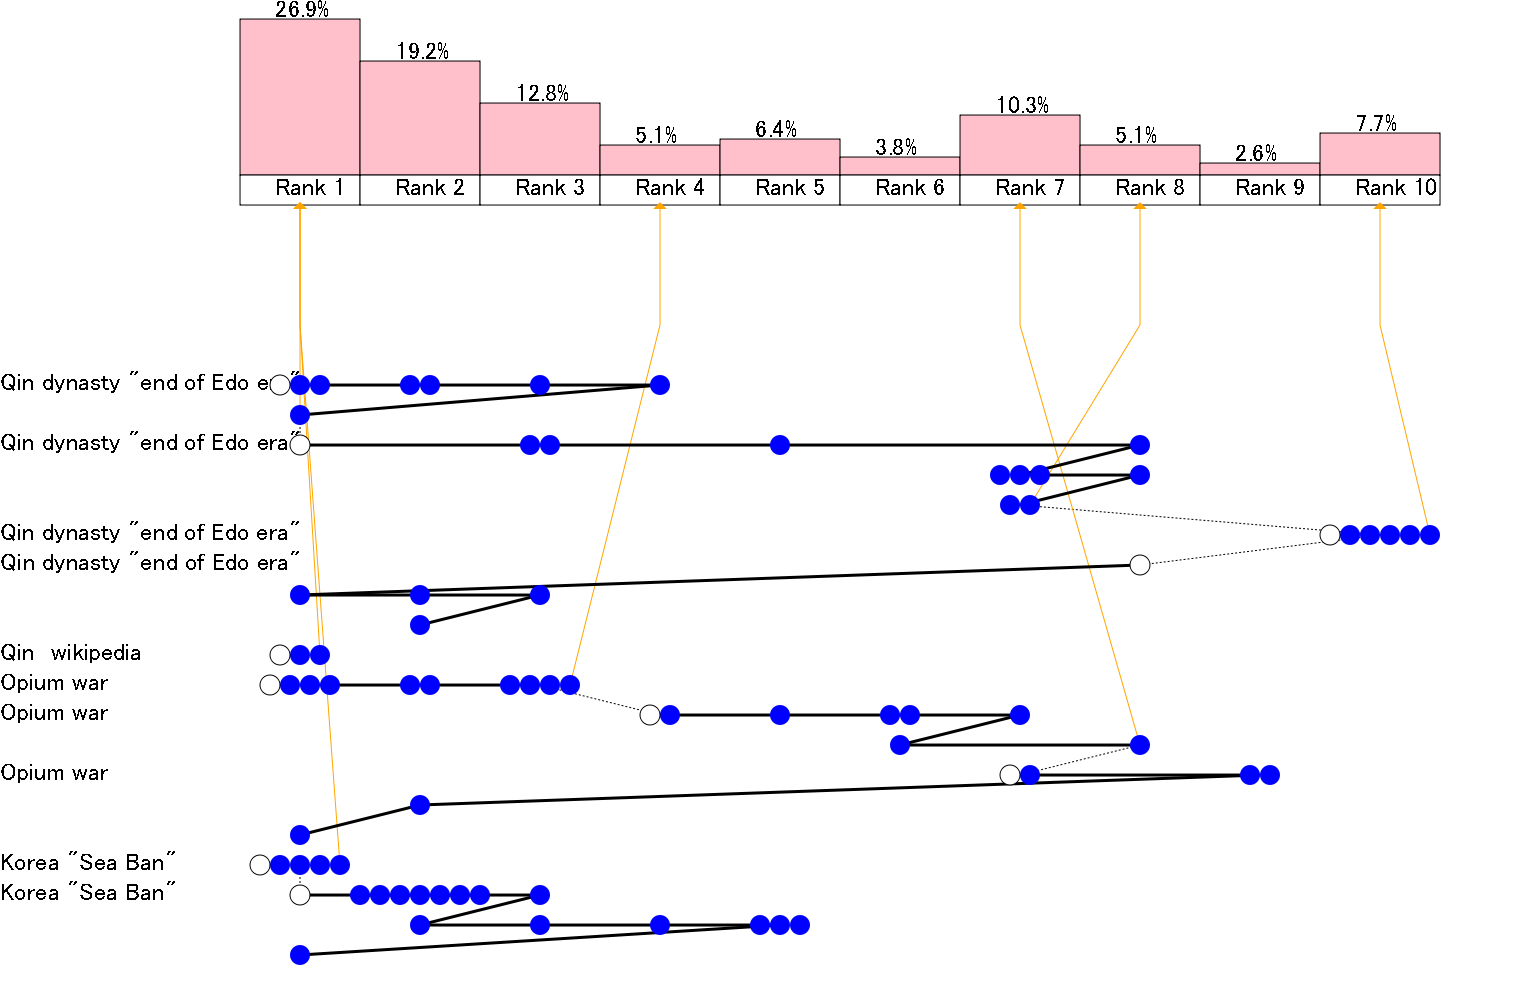
  1-1-1-2-2-3-4-1-link->(1)   Qin dynasty "end of Edo era"
  1-3-3-5-8-7-7-7-8-7-7-link->(8)     Qin dynasty "end of Edo era"
  10-10-10-10-10-10-link->(10)    Qin dynasty "end of Edo era"
  8-1-2-3-2        Qin dynasty "end of Edo era"
  1-1-1-link->(1)     Qin wikipedia
  1-1-1-1-2-2-3-3-3-3-link->(4) Opium war
  4-4-5-6-6-7-6-8-link->(7) Opium war
  7-7-9-9-2-1  Opium war
  1-1-1-1-1-link->(1) Korea "Sea Ban"
  1-2-2-2-2-2-2-2-3-2-3-4-5-5-5-1       Korea "Sea Ban"
Each line represents eye-movements data, click-rank, and a query. For example, the first line shows that a user issued a query about the 'Qin dynasty at the "end of Edo era"', and the user viewed rank 1, 1, 1, 2, 2, 3, 4, and 1 in that order on the results page, and then clicked rank 1 on it. Output for the example above is the following image, which has been converted from SVG format to PNG format:
Please refer to the following paper for an overview of visualization:
This tool is an outcome of the CRES Project. This project was partially supported by the Ministry of Education, Science, Sports and Culture, Grant-in-Aid for Scientific Research on Priority Areas A01-38 titled "Information Access Technologies Supporting Exploration and Learning" (19024068) and by a National Institute of Informatics Joint Research Grant titled "Study on Construction of Cognitive Models for Information Seeking Behavior and Its Applications".
If you have any questions or comments, please send an email to the following address:
![cres [_at_] nii.ac.jp](http://cres.jpn.org/?plugin=attach&refer=Files&openfile=mail.gif)